Downloads:
Index Matlab source code:
Index Database:
Matlab Source Code:
plot_Lab.m:
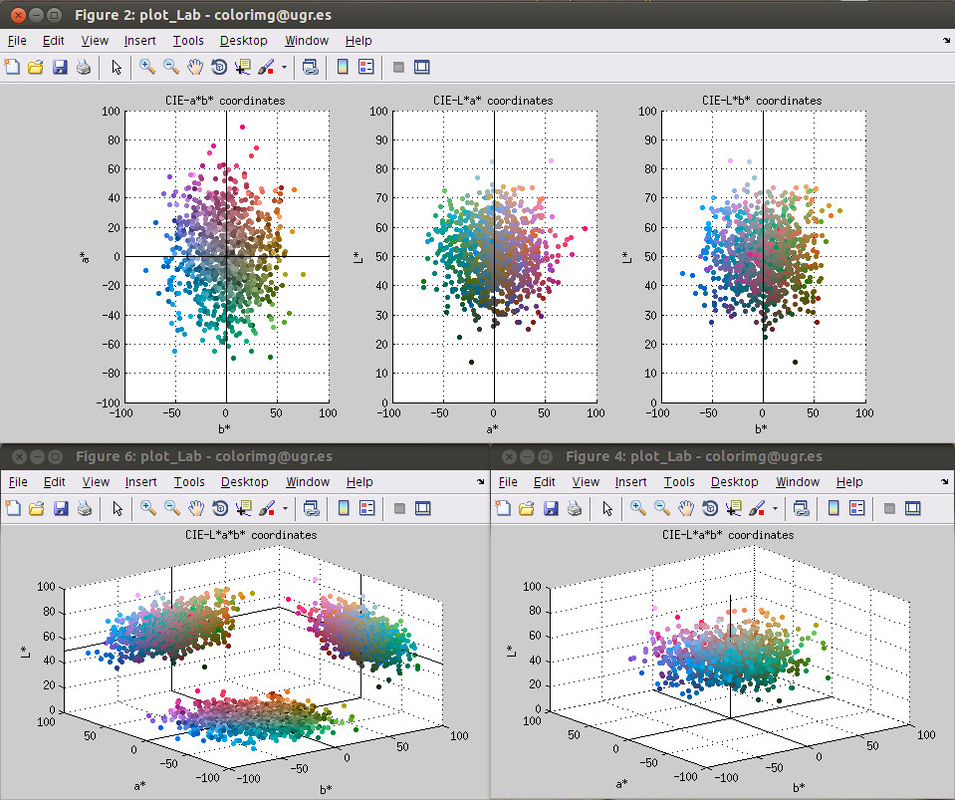
The plot_Lab function is a simple tool to create nice-looking Matlab figures of CIE-L*a*b* color coordinates of a set of data samples.
Features:
Figures can be exported to scalable vector graphics (svg) using 'plot2svg.m' by Juerg Schwizer (http://www.mathworks.es/matlabcentral/fileexchange/7401-scalable-vector-graphics-svg-export-of-figures). To use this feature, plot2svg.m must be available.
Simply run 'plot_Lab(0,0,0,0,0,0)' for a demo of all plot types with example data.
Click here to Download
Features:
- plots can be created in true-color (each datapoint is plotted with the marker face color corresponding to that of the data sample)
- plots can be created in pseudo-color (each sample is plotted in one color that is specified with the function call. Another call of the function allows plotting another set of data samples in the same figure)
- 2D plots illustrate the data points in three subplots (a*b*;L*a*;L*b*)
- 3D plots illustrate the data points in the 3D Lab space.
- projected 3D plots illustrate the data points in a 3D space, but samples projected in the a*b*, L*a*, L*b* plane.
Figures can be exported to scalable vector graphics (svg) using 'plot2svg.m' by Juerg Schwizer (http://www.mathworks.es/matlabcentral/fileexchange/7401-scalable-vector-graphics-svg-export-of-figures). To use this feature, plot2svg.m must be available.
Simply run 'plot_Lab(0,0,0,0,0,0)' for a demo of all plot types with example data.
Click here to Download
plot_lab_error.m:
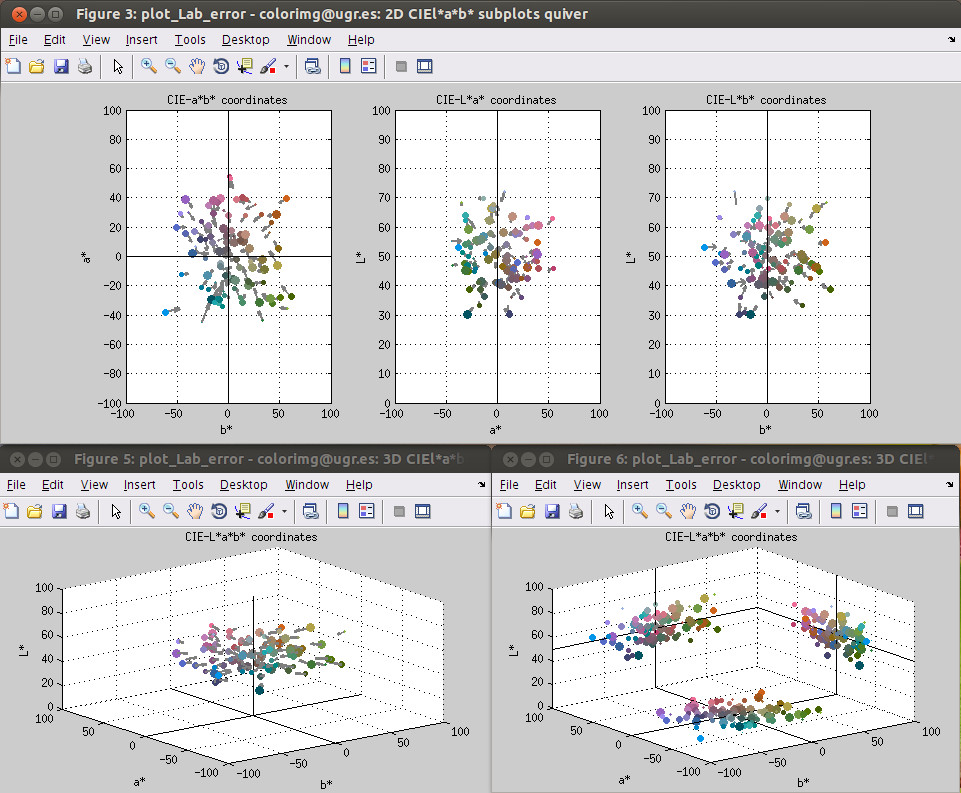
This function can be used to illustrate error values related to datapoints of CIE-L*a*b* color coordinates. A larger error is plotted by a larger marker, or in quiver plots by longer vectors. This is useful to illustrate for instance color differences of reconstructed color coordinates or reconstructed spectral reflectance data. Also other errors realted to the data can be illustrated, eg. RMSE (the errors have to be normalized to a maximum value of 1).
Illustrating errors in Lab plots allows to identify dependencies of the error with color. The quiver plots allow to identify global or local trends of the errors.
Illustrating errors in Lab plots allows to identify dependencies of the error with color. The quiver plots allow to identify global or local trends of the errors.
- Run 'plot_Lab_error(0,0,0,0,0)' for a demo of all plot types!!
- Note: depending on the error value range used, 'vec_scale' and 'err_scale' (line 47 and 49) might require to be adjusted to the data.
- if you are looking only for a way to illustrate Lab color coordinates, check 'plot_Lab.m' in Matlab File Exchange (http://www.mathworks.com/matlabcentral/fileexchange/44965).
- the figures can be exported to scalable vector graphics (svg) usoing 'plot2svg.m' by Juerg Schwizer (http://www.mathworks.es/matlabcentral/fileexchange/7401-scalable-vector-graphics-svg-export-of-figures)
im_cube_slicer.m: Hyperspectral Image Cube Slicer
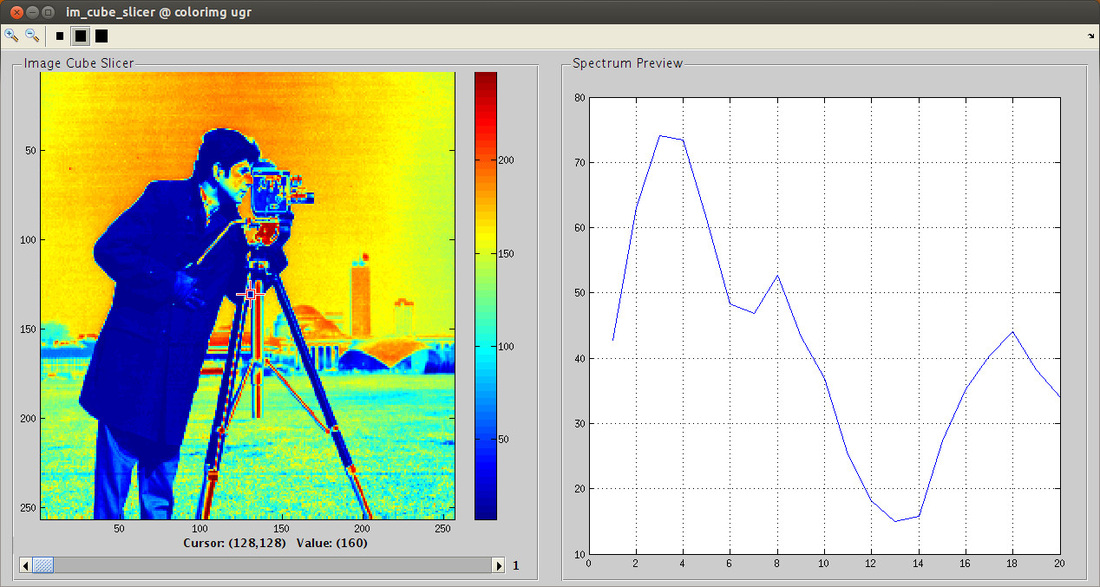
Implementation of an image cube slicer for multi-channel images (eg. hyperspectral-, MRI-, satelite- or any other kind of image data with more than 1 band).
The image cube slicer contains of an image band screen in the left panel, where an image plane is illustrated (either using imshow() or imagesc()). The image plane is selected using a slider tool located below the image plane.
Further, a draggable rectangle area is placed in the center of the image. The right panel illustrates the average data values (as a 1D-plot) for each band of the data cube that correspond to the currently selected rectangle area. Four different rectangle areas can be selected.
In case of hyperspectral images, the right panel plot corresponds to the (average) spectral signal of the current selection.
Click here to download
im_cube_pair_slicer.m: Hyperspectral Image Cube Pair Slicer
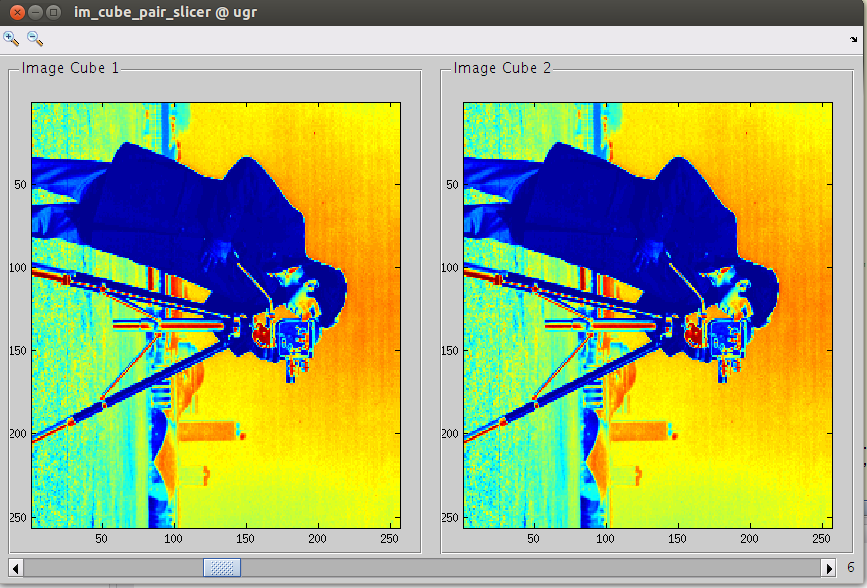
The image cube pair slicer is quite similar to the Hyperspectral Image Cube Slicer. Instead of visualizing spectral data, a second cube is shown in the right panel. The slider allows selecting individual image bands to illustrate from the cube.This tool is helpful when it comes to compare two data cubes. Example applications are:
- check performance of image registration of two cubes
- check before and after effect of some image processing applied
- compare two different cubes band-wise
Spectral Estimation Toolbox:

...coming soon...
Database:
Labial Teeth and Gingiva Image Database - LTG-IDB:
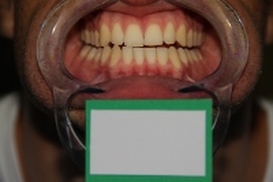
The LTG-IDB currently contains 90 photographic digital still images from 27 subjects. Images are available in several sets that differ by resolution, file format and image scene type. This leads to a total of 405 images occupying about 7GB of memory.
Images in this database are available in raw image format (which is the unprocessed sensor data of the camera in a specific vendor dependent data format, in this case the Canon raw image format cr2), as well as JPEG and TIFF. The strengths of this database are the fixed, well-defined and well known parameters of image acquisition. In addition, the variety of analytical and methodological applications shall be highlighted, as this database includes raw images, as well as pre-processed JPEG and TIFF images and is published under a creative common license.
A detailed description on the properties of this databse is given in: T. Eckhard, E. Valero, J. Nieves, F. Mesa, "The Labial Teeth and Gingiva Photographic Image Database LTG-IDB, technical report", 2011 .
Click here to download
